JAVA Jung2 drawing network topology
看到同事用Python写了一个画topology的脚本,感觉很有意思,如果优化下,功能会更实用。最近在看java,是否java也有很好的API可以用?有了这种想法就来Google下吧,在Stackoverflow上发现了两篇需求差不多的文章:
How to dynamically display a simulated network topology in Java
comparing open source java graph drawing frameworks(JUNG and Prefuse) for drawing network topology
上面提到了几个不错的API,JUNG,Prefuse和JGraphX,这偏文章只总结JUNG。关于JUNG的包可以通过下面官网下载:http://jung.sourceforge.net
最新的版本也是5年前的版本了:JUNG 2.0.1,下载下来后是一个zip包,里面包含所有相关的JAR文件,解压后放好,可以随时调用,下面是介绍如何通过Eclipse调用JUNG2:
1. 在project文件夹上右击鼠标,选“Configure Build Path”
2. 在Libraries中点“Add External JARs”,选上刚才解开的JAR包,就加进去了,然后直接import就可以了
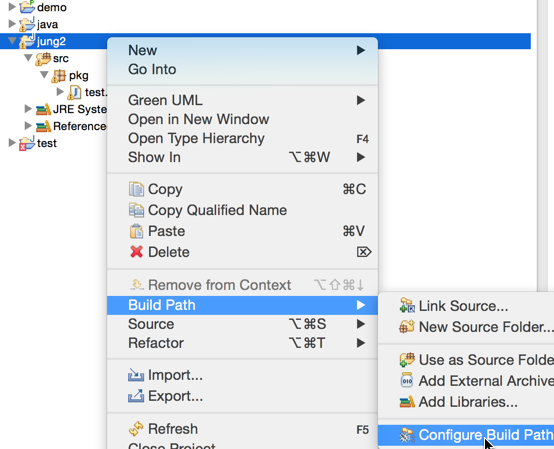
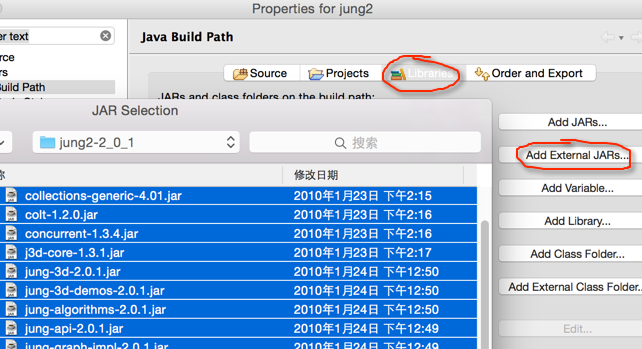
网络/图应用开发通用基础架构JUNG
JUNG2-Tutorial
另外配合英文文档中的example,完整代码可以从下面找到:
http://www.grotto-networking.com/JUNG/
1. 首先是简单的数据结构
package pkg;

import edu.uci.ics.jung.graph.Graph;
import edu.uci.ics.jung.graph.SparseMultigraph;

public class test {
	public static void main(String[] args) {
	// Graph<V, E> where V is the type of the vertices
        // and E is the type of the edges
        Graph<Integer, String> g = new SparseMultigraph<Integer, String>();
        // Add some vertices. From above we defined these to be type Integer.
        g.addVertex((Integer)1);
        g.addVertex((Integer)2);
        g.addVertex((Integer)3);
        // Add some edges. From above we defined these to be of type String
        // Note that the default is for undirected edges.
        g.addEdge("Edge-A", 1, 2);
        g.addEdge("Edge-B", 2, 3);
        // Let's see what we have. Note the nice output from the
        // SparseMultigraph<V,E> toString() method
        // Note that we can use the same nodes and edges in two different graphs.
        System.out.println("The graph g = " + g.toString());
	}

}
结果为:
The graph g = Vertices:1,2,3
Edges:Edge-B[2,3] Edge-A[1,2]
上面蓝色标记的内容为对象g包含的内容,三个点,两条边,点1和2组成边A,点2和3组成边B
2. 把上面的数据画成图
加入下面代码,可生成图片
import javax.swing.JFrame;
import edu.uci.ics.jung.algorithms.layout.CircleLayout;
import edu.uci.ics.jung.algorithms.layout.Layout;
import edu.uci.ics.jung.visualization.BasicVisualizationServer;

//下面代码加入main中
Layout<Integer, String> layout = new CircleLayout(g);
BasicVisualizationServer<Integer,String> vv = new BasicVisualizationServer<Integer,String>(layout);
JFrame frame = new JFrame("Simple Graph View");
frame.setDefaultCloseOperation(JFrame.EXIT_ON_CLOSE);
frame.getContentPane().add(vv);
frame.pack();
frame.setVisible(true);
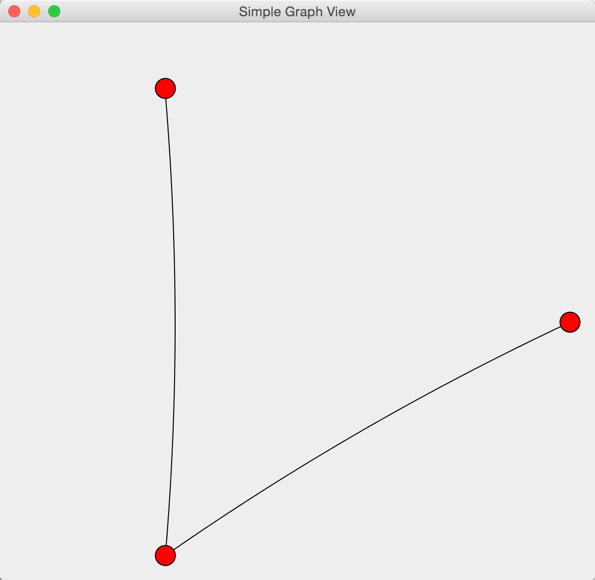
执行后截图如下:
3. 通过鼠标移动点改变拓扑
注意code,我用的是PICKING,具体有几种什么意思,可以查看文档,不做过多介绍;另外把“BasicVisualizationServer”删除,用“VisualizationViewer”替换,下面是要增加的code:
import edu.uci.ics.jung.visualization.VisualizationViewer;
import edu.uci.ics.jung.visualization.control.DefaultModalGraphMouse;
import edu.uci.ics.jung.visualization.control.ModalGraphMouse;

VisualizationViewer<Integer,String> vv = new VisualizationViewer<Integer,String>(layout);
DefaultModalGraphMouse gm = new DefaultModalGraphMouse();
gm.setMode(ModalGraphMouse.Mode.PICKING);
vv.setGraphMouse(gm);
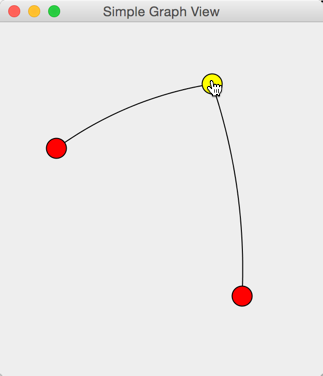
执行后截图如下:
4. 改变点/边的颜色,大小和图例
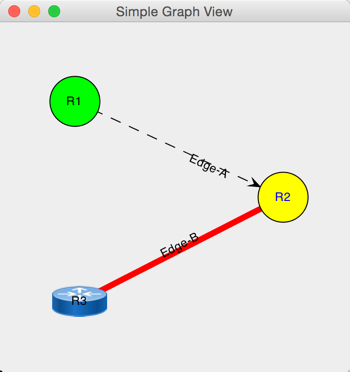
研究了一个周末,终于把基本的功能都搞定了,把剩下的几个功能都集中到一个实例里了,详细如下code:
package pkg;

import edu.uci.ics.jung.algorithms.layout.CircleLayout;
import edu.uci.ics.jung.algorithms.layout.Layout;
import edu.uci.ics.jung.graph.Graph;
import edu.uci.ics.jung.graph.SparseGraph;
import edu.uci.ics.jung.graph.SparseMultigraph;
import edu.uci.ics.jung.graph.util.EdgeType;
import edu.uci.ics.jung.visualization.BasicVisualizationServer;
import edu.uci.ics.jung.visualization.VisualizationViewer;
import edu.uci.ics.jung.visualization.control.DefaultModalGraphMouse;
import edu.uci.ics.jung.visualization.control.ModalGraphMouse;
import edu.uci.ics.jung.visualization.decorators.EdgeShape;
import edu.uci.ics.jung.visualization.decorators.ToStringLabeller;
import edu.uci.ics.jung.visualization.renderers.Renderer.VertexLabel.Position;

import java.awt.BasicStroke;
import java.awt.Color;
import java.awt.Dimension;
import java.awt.Paint;
import java.awt.Shape;
import java.awt.Stroke;
import java.awt.geom.AffineTransform;
import java.awt.geom.Ellipse2D;

import javax.swing.Icon;
import javax.swing.ImageIcon;
import javax.swing.JFrame;

import org.apache.commons.collections15.Transformer;

public class TopologyGraphView {
    /** Creates a new instance of TopologyGraphView */
    Graph<String, String> g;

    /**
     * @frank 2015.4.12
     */

    public TopologyGraphView() {
	// Graph<V, E> where V is the type of the vertices
        // and E is the type of the edges
        g = new SparseMultigraph<String, String>();
        // Add some vertices. From above we defined these to be type String.
        g.addVertex("R1");
        g.addVertex("R2");
        g.addVertex("R3");
        // Add some edges. From above we defined these to be of type String
        // Note that the default is for undirected edges.
        g.addEdge("Edge-A", "R1", "R2", EdgeType.DIRECTED);
        g.addEdge("Edge-B", "R2", "R3", EdgeType.UNDIRECTED);
        // Let's see what we have. Note the nice output from the
        // SparseMultigraph<V,E> toString() method
        // Note that we can use the same nodes and edges in two different graphs.
        System.out.println("The graph g = " + g.toString());
    }

    /**
     * @frank main function
     */
    public static void main(String[] args) {
    	TopologyGraphView sgv = new TopologyGraphView();
        // This builds the graph,为了让layout调用构造函数中的对象g,如下面的sgv.g
        // Layout<V, E>, VisualizationComponent<V,E>
        Layout<String, String> layout = new CircleLayout(sgv.g);
        layout.setSize(new Dimension(300,300)); // not frame's size, but layout size

        VisualizationViewer<String,String> vv = new VisualizationViewer<String,String>(layout);
        vv.setPreferredSize(new Dimension(350,350)); // 可以改变frame的大小

        // 加入通过鼠标互通的代码
        DefaultModalGraphMouse gm = new DefaultModalGraphMouse();
		gm.setMode(ModalGraphMouse.Mode.PICKING);
        vv.setGraphMouse(gm);

        // Setup up a edge to paint transformer...
        // https://stackoverflow.com/questions/23888613/how-to-change-colour-of-an-
        //edge-in-jung-graph-visualization-library
        // 把Edge-B默认的黑色改成红色
        Transformer<String,Paint> teColor = new Transformer<String,Paint>() {
            public Paint transform(String i) {
            	if (i.equals("Edge-B"))
                	return Color.RED;
            	else
            		return Color.BLACK;
            }
        };

        // Setup up a vertex to paint transformer...
        // https://stackoverflow.com/questions/8458970/change-size-color-of-vertex-in-jung
        // 把蓝色通过Transformer返回给vertexPaint
        Transformer<String,Paint> vertexColor = new Transformer<String,Paint>() {
            public Paint transform(String i) {
            	if (i.equals("R1"))
                	return Color.GREEN;
            	else
            		return Color.YELLOW ;
            }
        };

        // Setup up a vertex to Icon transformer...
        // 用图来替代默认的点
        Transformer<String, Icon> vertexIcon = new Transformer<String,Icon>() {
            public Icon transform(String x) {
            	ImageIcon ic = new ImageIcon("router.png");
            	if (x.equals("R3"))
            		return ic;
            	else
            		return null;
            }
        };

        // Change default vertex size to transformer...
        // https://stackoverflow.com/questions/8458970/change-size-color-of-vertex-in-jung
    	// 注意,前两个(-25,-25)是x,y的坐标,必须用负值,值等于半径(50是总长和总宽)
        Transformer<String,Shape> vertexSize = new Transformer<String,Shape>(){
            public Shape transform(String i){
                Ellipse2D circle = new Ellipse2D.Double(-25, -25, 50, 50);
                	return circle;
            }
        };

        // Set up a new stroke Transformer for the edges
        // BasicStroke用法:http://momsbaby1986.iteye.com/blog/1462901
        // 把设置好的画笔通过Transformer返回给edgeStrokeTransformer
        Transformer<String, Stroke> edgeStrokeTransformer = new Transformer<String, Stroke>() {
            float test[] = {10.0f};
            final Stroke dottedStroke = new BasicStroke(1.0f, BasicStroke.CAP_ROUND,
            		BasicStroke.JOIN_MITER, 10.0f, test, 0.0f);
            final Stroke thickStroke = new BasicStroke(6);
            public Stroke transform(String s) {
            	if (s.equals("Edge-A"))
            		return dottedStroke;
            	else
            		return thickStroke;
            }
        };

        vv.getRenderContext().setVertexIconTransformer(vertexIcon);
        vv.getRenderContext().setVertexFillPaintTransformer(vertexColor);
        vv.getRenderContext().setVertexShapeTransformer(vertexSize);
        vv.getRenderContext().setVertexLabelTransformer(new ToStringLabeller());
        vv.getRenderContext().setEdgeLabelTransformer(new ToStringLabeller());
        vv.getRenderer().getVertexLabelRenderer().setPosition(Position.CNTR);
        vv.getRenderContext().setEdgeStrokeTransformer(edgeStrokeTransformer);
        vv.getRenderContext().setEdgeDrawPaintTransformer(teColor);
        vv.getRenderContext().setEdgeShapeTransformer(new EdgeShape.Line<String,String>());
        // How to draw Straight line by JUNG2?
        // http://stackoverflow.com/questions/29587011/how-to-draw-straight-line-by-jung2

        JFrame frame = new JFrame("Simple Graph View");
        frame.setDefaultCloseOperation(JFrame.EXIT_ON_CLOSE);
        frame.getContentPane().add(vv);
        frame.pack();
        frame.setVisible(true);
    }

}
执行后截图如下:
版权声明:
本文链接:JAVA Jung2 drawing network topology
版权声明:本文为原创文章,仅代表个人观点,版权归 Frank Zhao 所有,转载时请注明本文出处及文章链接